We’ve officially put 2024 behind us, and it marked another strong year for the stock market. The S&P 500 Index (SPX) posted a gain of over 20% for the second consecutive year. In this article, I’ll explore how the stock market has historically performed based on the prior year’s returns. Additionally, I’ll examine what history suggests we might expect from stocks this January, given the impressive performance last year. Lastly, I’ll analyze whether a third consecutive strong year for the S&P 500 is within the realm of historical possibilities.
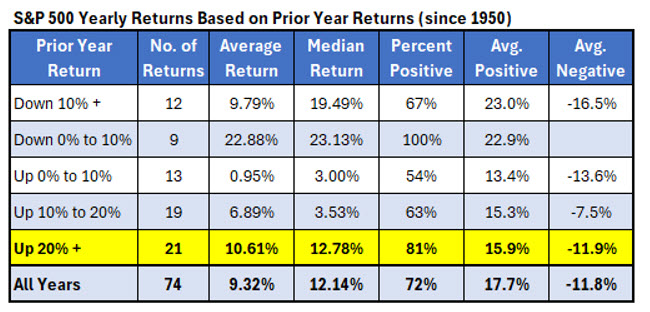
The table below breaks down S&P 500 yearly returns since 1950. It summarizes the index returns based on how it did in the prior year. With the strong performance in 2024, we can expect more gains in 2025. When the S&P 500 has gained 20% or more in a year, the next year has averaged a gain of 10.6%, which is better than its typical return of 9.3%. Also, after these strong years, the index was positive 81% of the time. It looks like the sweet spot for stocks is following a year in which it was moderately down. When the S&P 500 was down but not by more than 10%, it was positive all nine times averaging a gain of 23% the next year.
Based on the 20% gain last year, don’t get too excited yet. January has significantly underperformed after strong years. Going back to 1950, the S&P 500 has gained just over 1% on average in January with 59% of the returns positive. After years in which the index gained 20% or more, however, it has been about breakeven on average with 52% of the returns positive.
After gains of 24% in 2023 and 23% in 2024, is it too much to hope for another strong year in the stock market? Back-to-back 20% gains for the S&P 500 are rare, but they have happened before. The table below lists each time since 1950. In 1954 and 1955, the index posted consecutive 20%+ gains. However, 1956 started with a 3.6% drop in January and ended with a return of just 2.6% on the year.
The next occurrence was in 1995 and 1996. Stocks spiked right off the bat with the S&P 500 surging over 6% in January of 1997 and finishing the year up more than 30%. This made 1997 another 20%+ year. Then came 1998, which delivered a 27% return—marking four consecutive years of 20%+ gains. Even 1999 came close, with a 19.5% gain, narrowly missing a fifth straight yearly move of 20%. Of course, this streak ended with the bursting of the tech bubble, as the S&P 500 fell by double digits in each of the next three years.


